You’ve built dashboard after dashboard and people still don’t trust the numbers.
Sound familiar?
It’s not your SQL. It’s not the visualization. It’s that every dashboard hides a different version of the truth. And once your data stack hits scale, BI breaks down — fast.
Dashboards weren’t built to define metrics; they were built to show them.
That’s where semantic layer tools change the game. They help you define metrics once, reuse them everywhere, and eliminate confusion before it starts.
Let’s dig into why dashboards break, how semantic layers fix the mess, and which tools actually scale for modern data analysts.
Dashboards Weren’t Built To Scale – Here’s Why They Break Down?
Dashboards were great when you had a few analysts and simple SQL queries. But once you hit scale with dozens of metrics, tools, and stakeholders, they start to fall apart. Why?
Because dashboards weren’t designed to manage complexity; they were built to visualize what’s already defined. And that’s where most teams run into serious pain.
Let’s break down what actually goes wrong.
1. Logic Lives Inside The Dashboard
How many times have you seen this happen?
Two dashboards showing revenue, and both are off by a few million. It’s not a mistake. It’s a symptom of metric logic living inside every dashboard.
Analysts write custom SQL or define business logic on the fly, and then that logic gets buried in the dashboard.
- There’s no centralized data logic that acts as a source of truth
- Everyone creates their own version of a metric
- Even simple KPIs like “active users” get redefined 10 different ways
This leads to metric drift, and it kills trust.
The question is, why don’t teams just align on definitions upfront? Because most BI workflows don’t make that easy and separate visualization from logic definition.
The fix? Pull the logic out of the dashboards and into a semantic layer that defines once and for all tools.
2. Duplicated Work Across Teams
Let’s say your marketing and finance teams both need a “new customers by month” chart.
So what happens? They build it separately. They apply their own filters, joins, and naming conventions. One includes trials; the other doesn’t.
Multiply that by 30 teams, and you’re looking at dozens of analysts duplicating the same work.
- Wasted hours writing nearly identical queries
- Conflicting definitions of core metrics
- Endless Slack threads arguing which version is “correct”
And even worse? When people stop trusting dashboards, they start making decisions offline, i.e., in Excel, via gut feel, or with outdated PDFs.
If everyone’s rebuilding the same metric, your BI stack is already broken.
This is where reusable data definitions matter. A semantic layer solves this by letting you define once and reuse it across every team and tool.
3. Performance Bottlenecks On Warehouse
Dashboards are dynamic. But that power comes at a cost, especially when every refresh hits the warehouse with full, unoptimized queries.
That’s right:
- Each dashboard interaction = fresh warehouse query
- No pre-aggregations, no caching
- Multiply by dozens of users = warehouse bills that balloon overnight
A $50 million company loses over $875K/year due to data downtime, and teams waste 1,200+ hours/week fixing data quality issues instead of driving growth. (Source: Monte Carlo)
Dashboards aren’t just slow — they’re expensive.
Semantic layers, such as Cube.dev, introduce query optimization, caching, and pre-aggregation. That means dashboards get faster, and you stop melting your warehouse.
4. Governance and Trust Issues
When everyone can build a dashboard, who owns the data?
Without governance, the logic behind KPIs becomes a black box. Nobody knows:
- Where a metric is used
- Who’s responsible for maintaining it
- Whether it matches what’s in another tool
It’s not just a tech problem. It’s a trust problem. If your VP of Sales sees one number in Tableau and another in Excel, the dashboard loses all credibility.
So, how can you build trust without visibility into definitions?
You can’t unless you centralize metric logic and track its usage across tools. A semantic layer provides the transparency and audit trail you need.
5. No Version Control Or Reuse
You can’t scale what you can’t track.
Dashboards often rely on drag-and-drop interfaces. While great for speed, they hide logic behind the UI. There’s no:
- Git history
- CI/CD testing
- Change approvals or promotion workflows
That means one wrong filter can break dozens of dashboards and no one knows until after the damage is done.
This is why semantic modeling best practices include defining metrics in code (YAML, dbt, LookML). You version them. You test them. You promote them just like your production code.
If your metrics aren’t versioned, your BI isn’t production-grade.
Semantic layers make your analytics stack as scalable and safe as your engineering stack.
Read Also: Data Modeling Best Practices
Enter The Semantic Layer – The Missing Link In Modern BI
Most dashboards don’t fail because of design but because metric logic lives in the wrong place. Definitions are scattered, duplicated, and buried in tools built to visualize data, not define it.
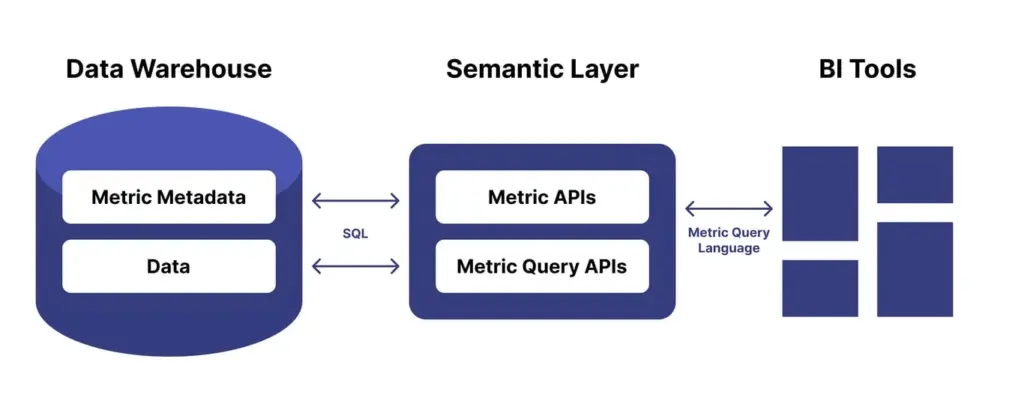
That’s where the BI semantic layer makes a significant difference. It acts as the connective tissue between your warehouse and your tools, defining KPIs, joins, and filters once and then serving them consistently across dashboards, notebooks, and AI agents.
So, why is the semantic layer such a game-changer? Let’s break it down.
Unified Definitions, Reused Across Tools
Your team shouldn’t have to ask, “Which dashboard is right?”
They should be able to ask, “What does revenue mean?” and get a single, governed answer.
That’s the promise of centralized data logic.
A semantic layer defines your business metrics in one place, then exposes them to:
- BI tools like Tableau, Power BI, Hex
- AI agents that query live data using natural language
- Notebooks, Excel, and even Slack bots
Imagine a single “active customers” definition working across 10 tools without rewriting SQL.
While exact numbers vary, teams adopting semantic layers often report quite fewer analytics bugs because metric logic is no longer duplicated across tools.
Abstracted Complexity For Analysts
Let’s be honest. Most business users don’t want to write SQL. And most analysts shouldn’t be bogged down writing the same joins every week.
Semantic layers abstract the hard stuff:
- Analysts explore governed metrics using drag-and-drop
- SQL is automatically generated under the hood
- Complex logic (like LTV calculations or retention cohorts) is defined once by data engineers
This removes friction for business users and keeps engineers focused on high-leverage work.
Here, one question arises: why are analysts writing the same queries over and over?
Because they don’t have access to governed, reusable metrics. The semantic layer gives them that power—safely.
When paired with dbt semantic layer integration, this becomes more robust. You define models in dbt and then expose them as semantic objects for consumption across various tools.
Needed For AI-Driven Workflows
The shift to AI isn’t coming — it’s already here.
Whether it’s an internal chatbot, a Slack assistant, or an LLM writing SQL, every AI system needs a structured, trustworthy context. Dashboards can’t provide that. Semantic layers can.
Here’s why:
- They define metrics and relationships in structured, machine-readable formats
- They offer metadata, dimensions, and constraints AI models can reason with
- They expose governed logic to agents so they don’t have to guess the SQL behind “revenue by region”
Tools like Honeydew.ai are built around this concept, with native AI agents querying semantic logic, not dashboards.
AI doesn’t guess; it needs definitions.
If you want to scale LLM-powered insights, your metrics need structure. And that means a semantic layer underneath.
The 5 Best Semantic Layer Tools To Use Now
Not every team needs the same tool. Some are all-in on Snowflake. Others build in dbt. Some want AI-driven insights, while others care about Excel governance at scale.
What matters most is the fit for your stack and how well a tool helps you move toward scalable BI architecture.
Let’s look at the top semantic layer tools—from open-source APIs to enterprise-grade engines.
1. Cube.dev
The API-first, open-source semantic layer built for speed and control.
Cube.dev stands out for teams that need flexible, performant analytics infrastructure, especially in embedded analytics or SaaS products. With native dbt semantic layer integration, it bridges the gap between transformation logic and BI usage.
What makes Cube.dev powerful?
- Defines metrics, joins, and access control using code
- Caches and pre-aggregates queries for lightning-fast dashboards
- Easily integrates with dbt, React, and modern frontends
- Great for product analytics, customer dashboards, and custom data apps
If you want semantic power without vendor lock-in, start with Cube.dev. It’s perfect for data teams that want full control, performance tuning, and open standards.
2. Honeydew.ai
AI-native semantic layer with built-in agents and prompt interfaces.
Honeydew.ai takes a fresh approach, built from the ground up with AI in mind. It’s ideal for fast-moving startups or teams experimenting with AI assistants, prompt-based analytics, and conversational BI.
Why it’s different:
- Uses LLMs to suggest joins, definitions, and KPIs
- Built-in AI agents for data discovery and natural language queries
- No-code metric layer that works across tools
If your CEO wants ChatGPT for your warehouse, Honeydew delivers.
It’s an early-stage solution but is already a favorite among AI-first teams seeking rapid and intuitive data access.
3. Snowflake Semantic Views
Snowflake’s built-in semantic layer for performance and control inside the data cloud.
For teams already invested in Snowflake, Semantic Views offers a way to build governed metrics without leaving the warehouse. It brings compiler-level performance and tight coupling with Snowflake’s query engine.
What stands out?
- Define metrics in SQL or YAML inside Snowflake
- Optimized execution via Snowflake compiler
- No data movement or sync delays, it’s all native
Looking to migrate to Snowflake or already living in it? This is your shortest path to a semantic layer.
Best fit for Snowflake-first teams that want minimal setup and enterprise-grade performance.
Read Also: Snowflake Vs. BigQuery
4. AtScale
The OG of semantic layers—now modernized for cloud OLAP and scale.
AtScale is battle-tested. It’s an enterprise-grade semantic modeling tool that brings strong governance, deep Excel integration, and robust OLAP capabilities. If your execs still love pivot tables, this is your tool.
Why enterprises choose AtScale:
- Supports dimensional modeling at scale
- Works natively with Excel, Tableau, Power BI
- Includes AI acceleration and smart caching
- Strong lineage, auditing, and access control
Are you still living in Excel hell? AtScale brings semantic order to chaos.
Ideal for organizations that juggle multiple BI tools and require vigorous governance across platforms.
5. LookML (Looker)
The original semantic layer—code-first and deeply governed.
LookML is Google’s semantic modeling language inside Looker. It was one of the first to let you define metrics, joins, filters, and drill paths in reusable code. It’s still trusted by teams that want governed, consistent, and shareable metrics.
Strengths include:
- Define metrics once, use across Looker
- Strong data governance and access rules
- Git-based version control, testable logic
- Native dbt model referencing
Love Looker? You’re already using a semantic layer. However, if you require cross-platform access, LookML has limitations, specifically that it’s Looker-bound.
Benefits of Semantic Layers That Make Dashboards Obsolete
Dashboards will always have a place. But they were never meant to carry the weight of metric definition, governance, or performance tuning.
When every visualization becomes a custom-coded view of the data, trust erodes, and scale breaks down. That’s why semantic layers don’t replace dashboards but make them finally work.
Let’s break down the real-world benefits that semantic layer tools unlock.
1. Define Once, Use Everywhere
Revenue often lives in a dozen dashboards, half a dozen reports, and scattered spreadsheets, each telling a slightly different story. One includes discounts. One doesn’t. Another excludes refunds. And now you’re back to square one: Which one is right?
Semantic layers eliminate that question by centralizing logic. Define a metric once, and expose it to:
- Tableau
- Power BI
- Hex
- Excel
- Internal APIs
- AI agents
This isn’t theoretical; it’s happening now. Teams with a centralized semantic layer often onboard analysts significantly faster. This is because they no longer need to reverse-engineer metric logic hidden in dashboards.
This is how reusable data definitions transform your analytics from opinion-based to consistent.
2. Query Optimization and Performance
Dashboards can slow to a crawl as more users query live data. What they don’t see is that each filter, each time range, and each refresh all trigger new warehouse queries.
Semantic layers introduce:
- Pre-aggregations (summed, grouped, cached in advance)
- Caching strategies (serve results without re-hitting warehouse)
- Optimized query plans (via compiler-level engines like Cube)
This reduces cost and improves experience. Teams using Cube.dev have reported up to 90% reduction in dashboard load times when paired with pre-aggregated semantic layers.
What do you think what’s cheaper? Scaling your warehouse or caching your metrics?
Exactly. Semantic layers give you speed and savings.
3. Stronger Governance and Auditability
When metric definitions are buried in dashboards, there’s no way to answer:
- Who created this KPI?
- Where is it used?
- Has it changed in the last month?
With a semantic layer, every metric:
- Has a clear owner
- Tracks lineage and usage
- Can be reviewed before changes go live
This supports data contracts, compliance, and internal controls, especially in regulated industries or large-scale teams.
If your CFO asks, “Who changed the revenue logic?” You better have an answer!
A governed semantic layer gives you that confidence.
4. Version Control and Git-Based Workflows
You wouldn’t deploy app code without Git. So why deploy metric definitions without it?
Semantic layers let you:
- Write metrics in code (YAML, LookML, dbt)
- Store logic in Git repos
- Run CI/CD pipelines to validate changes
- Promote changes safely between dev → staging → prod
This turns your BI stack into a modern data development environment. You get pull requests, code reviews, and rollbacks — just like your software team.
Dashboards aren’t code. Semantic layers are.
That’s why they scale, and dashboards don’t.
5. Easier Debugging and AI Integration
When someone says “the number looks wrong,” what do you do?
Without a semantic layer:
- You open the dashboard
- Reverse-engineer the SQL
- Guess which join or filter caused the issue
With a semantic layer:
- You inspect the governed metric definition
- View the exact SQL that was generated
- Trace every transformation step clearly
Even better, with structured definitions, you can plug AI directly into your BI stack:
- Trigger LLMs to explain anomalies
- Use agents to build new charts via prompts
- Leverage AI on top of real, governed metrics
Want AI in your BI? Then start by structuring your logic.
Dashboards show numbers. Semantic layers explain them and power intelligent workflows.
Getting Started – Best Practices For Deploying Semantic Layers
Most teams recognize the need for a semantic layer. The hesitation? Not knowing where to start without breaking what already works.
The good news is that you don’t need to rip and replace.
You can start small, plug into what you already use, and scale up confidently.
Here’s how we recommend deploying semantic layer tools based on 15+ years of helping teams modernize their BI stacks.
1. Start Small With Core Metrics
Before you touch tools or write YAML, start with alignment.
Pick your 5 to 10 most business-critical KPIs. These are often:
- Revenue
- Active users
- Customer churn
- CAC or LTV
- Conversion rate
Now define them together—product, marketing, data, and finance.
Agree on:
- Filters (e.g., what counts as an active user?)
- Dimensions (e.g., regions, customer types)
- Source models (e.g., Snowflake tables or dbt models)
If you can’t define 5 metrics clearly, tools won’t help.
This alignment acts as your semantic foundation, enabling you to build a scalable BI architecture on top of it.
2. Choose The Right Tool For Your Stack
There’s no one-size-fits-all semantic layer. Your stack should guide your choice.
- If you’re all-in on Snowflake, use Snowflake Semantic Views for performance and governance
- If your team builds in dbt, use Cube.dev, Honeydew, or Looker with native dbt semantic layer integration
- If your org lives in Excel + Tableau + Power BI, use AtScale, as it offers OLAP and dimensional modeling at scale
- If you’re an AI-native startup, go with Honeydew.ai and prompt-based agents
So, what tools do you want to keep using? The right semantic layer doesn’t replace them; it powers them smarter.
3. Integrate With Version Control Early
Even a small semantic layer project should start with Git.
It’s tempting to define metrics in a UI, but that becomes hard to maintain fast.
Here’s what we recommend:
- Use GitHub or GitLab to store metric definitions (LookML, YAML, dbt .yml files)
- Set up CI/CD pipelines to validate metrics before they go live
- Require pull requests and reviews before changes hit production
This workflow brings discipline, testing, and safety to your semantic layer deployment.
4. Document Ownership and Usage
Once you start defining metrics centrally, you’ll need to assign owners and track usage. This is where many teams fall short — they define once but don’t maintain it.
Set up:
- Metric owners (usually business stakeholders or data leads)
- Review cycles (monthly or quarterly check-ins)
- Usage dashboards (which tools, which teams, which charts use which metrics)
A quick question: who owns “net revenue” in your company?
If you don’t know, your semantic layer won’t stay trusted.
Semantic layers like Looker, AtScale, and Honeydew now include lineage tracking and metric-level visibility, making this easier to manage.
5. Don’t Kill Dashboards – Power Them Smarter
This isn’t a dashboard vs semantic layer fight. In fact, dashboards become more useful when backed by governed definitions.
Your users still want their Power BI charts. Your execs still want Looker. Your finance lead lives in Excel.
Keep all that.
Just plug them into the semantic layer so they:
- Pull the same definitions
- Reflect the same filters and joins
- Stay aligned, regardless of who’s viewing
Dashboards don’t need to die. They just need smarter plumbing.
This is headless BI and semantic layer architecture in action, decoupling logic from presentation.
Final Thoughts – Stop Rebuilding The Same Dashboard!
You’ve probably felt the pain by now.
The same metrics are rebuilt over and over. The endless questioning of “Which dashboard is right?” The finger-pointing when numbers don’t line up.
It’s not your analysts. It’s not your BI tool. It’s the fact that your logic is disconnected and hidden, spread across dashboards, spreadsheets, and SQL snippets.
That’s what semantic layer tools are built to fix.
When you define your logic once and reuse it across every tool, every user, and every workflow, something shifts.
- Your dashboards become faster and more trustworthy
- Your AI agents stop guessing and start querying correctly
- Your data team stops firefighting and starts innovating
A scalable BI strategy doesn’t begin with design. It begins with governed, shareable, and testable logic. It begins with a semantic layer that scales.
Ready To Implement Semantic Modeling Best Practices?
We help teams move from dashboard sprawl to structured, governed analytics environments using the right semantic layer tools without disrupting what already works.
Book a consultation, and we’ll help you design a modern BI foundation that scales with your team, tools, and ambitions.